5.2 Assignment 8
Your eighth assignment requires that you have read and understand Code that writes code.
Overview
In this assignment, you will learn how to use Go's ast package and write a program that produces a DOT visualization of your application.
1 Load packages
Your first task is to create a program in the cmd/dot directory that loads
Go packages into an *types.Package and prints out each of the loaded package
names. If your program fails to parse any of the packages, it should return
a non-zero exit code.
Example use of this program is shown below:
2 DOT graph
Now that you have a simple setup for loading packages, your next task is to use the loader you created in 1 Load packages and write a DOT visualization of the import graph.
Your program should traverse each of the packages imported by the top-level
*packages.Package (via the *packages.Package.Imports), and create a directed
edge between each package and its imports.
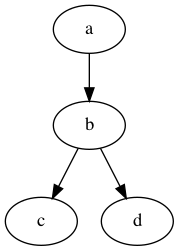
You can create a directed graph with the digraph keyword in a imports.dot file
like so:
The visualization this yields with the dot command is shown below:
In your solution, each node should be a fully-qualified import path, which can be
resolved by the *packages.Package.PkgPath field.
You are welcome to use OSS solutions for writing
DOTfiles if you prefer. Check out go-graphviz for inspiration!
Submitting
Notify your mentor that you have created the pull requests in the issue-tracker
repository. Your mentor will review your code and assign a grade before your next
weekly check-in.